: A Comprehensive Guide")
- Introduction
- What are Q1, Q2, Q3 and Q4 Journals?
- Metrics Used in Journal Ranking System
- Types of Journal Ranking Systems
- Comparison of Various Journal Ranking Systems
- I published my paper in a Journal when it was in Q1 and now it is in Q2: What should I indicate against my Research Paper( Q1 or Q2)?
- How to Identify To Which Quartile Journal I Should Submit My Research Paper?
- Conclusion
Introduction
As researchers and academics, we are often faced with the daunting task of navigating the complex world of journal rankings. What do Q1, Q2, Q3, and Q4 mean? How are journals ranked? What are the implications of journal rankings for researchers and journals alike? If you find yourself grappling with these questions, you’re not alone.
In this comprehensive guide, we will unravel the mystery of journal rankings, providing you with a deep understanding of how journals are ranked and what these rankings mean. Whether you’re a seasoned researcher aiming to publish in a high-ranking journal or a journal editor looking to improve your journal’s ranking, this guide will equip you with the knowledge you need to navigate the world of journal rankings with confidence.
Join us as we delve into the intricacies of journal rankings, uncovering the secrets behind Q1, Q2, Q3, and Q4 journals, and exploring the implications of these rankings for researchers, journals, and the broader academic community. Get ready to unlock the mystery of journal rankings and take your scholarly publishing journey to new heights. Let’s dive in!
If you are already aware of Journal quartiles but unsure of selecting which quartile has maximum chance of acceptance to my research paper, then surely visit my article on How to Choose Right Journal Quartile (Q1/Q2/Q3/Q4) for My Research Paper? In this article I have discussed about Journal Quartile Finder Tool, that will help you in identifying the best quartile for your research paper.
What is Journal Ranking System?
A technique for rating academic journals’ quality and impact is known as a journal quality ranking system or journal ranking system. Providing a gauge of the relative importance and prestige of journals within a certain field of research is the main objective of a journal ranking system.
Researchers, universities, funding agencies, and other organisations employ a variety of different journal ranking systems. The most well-known journal ranking methods are as follows:
- Journal Citation Reports (JCR) from Clarivate Analytics, uses the Impact Factor (IF) to rank journals. The Impact Factor is a measure of the number of citations received by a journal in a given year divided by the number of articles published in the journal in the previous two years.
- Scopus Journal Analyzer from Elsevier, uses the SNIP (Source Normalized Impact per Paper) and the SJR (SCImago Journal Rank) metrics to rank journals. SNIP is a measure of the contextual citation impact of a journal and takes into account the number of citations received by a journal, the number of articles published in the journal, and the prestige of the journals citing the journal in question. SJR, on the other hand, is a measure of the prestige of a journal and also takes into account the number of citations received by a journal, the number of articles published in the journal, and the prestige of the journals citing the journal in question.
- Web of Science from Clarivate Analytics, uses the Journal Impact Factor (JIF) to rank journals. JIF is similar to the Impact Factor and measures the average number of citations received by articles published in a journal in a given year divided by the number of articles published in the journal in the previous two years.
- SCImago Journal & Country Rank (SJR) use the same metric (SJR) as Scopus to evaluate the quality of journals and it is based on the number of citations, the number of articles and the prestige of the citing journals.
These methods use various measures and algorithms to rate journals, and each approach may produce different results. When analysing journal quality rankings, it’s critical to take into account the standards and constraints of each system.
General Definition: Journals are academic publications that serve as platforms for researchers to share their findings with the scholarly community. The quality and impact of journals can vary, often measured by factors such as citation counts, peer review processes, and editorial standards. Quartile rankings categorize journals into four groups based on their citation performance within specific subject categories.
What are Q1, Q2, Q3 and Q4 Journals?
- Q1 Journals (First Quartile):
- Definition: Journals ranked in the first quartile (Q1) are among the top 25% of journals in their subject category based on citation metrics within a citation database like Scopus or Web of Science.
- Characteristics:
- High impact and visibility within their field.
- Publish cutting-edge research with significant contributions.
- Attract a large number of citations from other scholars.
- Importance: Q1 journals are highly esteemed and are often the preferred venues for publishing groundbreaking research. They typically score 9 or 10 out of 10 in terms of importance.
- Q2 Journals (Second Quartile):
- Definition: Journals ranked in the second quartile (Q2) fall within the 26th to 50th percentile of journals in their subject category based on citation metrics within a citation database like Scopus or Web of Science.
- Characteristics:
- Moderate impact and visibility within their field.
- Publish research that is significant but may not be as groundbreaking as Q1 journals.
- Receive a moderate number of citations from other scholars.
- Importance: Q2 journals hold value and can contribute to a researcher’s reputation, typically scoring 6 or 7 out of 10 in importance.
- Q3 Journals (Third Quartile):
- Definition: Journals ranked in the third quartile (Q3) fall within the 51st to 75th percentile of journals in their subject category based on citation metrics within a citation database like Scopus or Web of Science.
- Characteristics:
- Lower impact and visibility compared to Q1 and Q2 journals.
- Publish research that may be of local or niche interest.
- Receive fewer citations from other scholars.
- Importance: Q3 journals may be suitable for publishing incremental or niche research, typically scoring 3 or 4 out of 10 in importance.
- Q4 Journals (Fourth Quartile):
- Definition: Journals ranked in the fourth quartile (Q4) are among the bottom 25% of journals in their subject category based on citation metrics within a citation database like Scopus or Web of Science.
- Characteristics:
- Lowest impact and visibility within their field.
- Publish research that may have limited significance or reach.
- Receive minimal citations from other scholars.
- Importance: Q4 journals offer a publication avenue but generally do not significantly enhance a researcher’s reputation, typically scoring 1 or 2 out of 10 in importance.
Metrics Used in Journal Ranking System
The world of academic publishing is governed by various metrics that are used to evaluate the impact and importance of journals. Among these metrics, the Impact Factor (IF) and Journal Impact Factor (JIF) are perhaps the most well-known, but they are not the only ones. Other important metrics used in journal ranking systems include Source Normalized Impact per Paper (SNIP) and SJR (SCImago Journal Rank) Metric.
These metrics play a crucial role in determining the ranking and prestige of journals, influencing where researchers choose to publish their work and how journals are perceived within their fields. In this section we will explore these key metrics used in journal ranking systems, shedding light on their significance and implications for the scholarly community. Understanding these metrics is essential for researchers, editors, and publishers alike as they navigate the landscape of scholarly publishing and seek to make informed decisions about where to publish and how to improve the visibility and impact of their work.
1. Impact Factor(IF)/Journal Impact Factor(JIF)
Typically, a journal ranking mechanism called the Journal Impact Factor is used to assess a journal’s quality (JIF). The JIF is a metric that gauges the typical number of citations received for each journal manuscript that is published. The JIF is computed by dividing the total number of papers published in a journal over the course of a given year by the total number of papers published in that journal over the course of the two years prior.
Impact Factor (IF) = (Citations in Year X / (Total Number of Articles Published in Years X-1 and X-2)
Where:
- Citations in Year X: The total number of citations received by all articles published in the journal in a specific calendar year (e.g., 2022).
- Articles Published in Years X-1 and X-2: The total number of articles published in the journal in the two preceding years (e.g., 2020 and 2021).
Let’s say a journal produced 100 articles in total in 2018 and 2019 and 350 citations were made to those papers in 2020. We would divide 350 by 100 to get the impact factor for the journal in 2020, which is 3.5. Therefore, the journal’s impact factor for 2020 would be 3.5.
Another illustration is a publication that published 120 articles in total in 2018 and 2019 and 400 citations in 2020. We would divide 400 by 120 to get the impact factor for the journal in 2020, which equals 3.33. Therefore, the journal’s impact factor for 2020 would be 3.33.
It’s important to remember that the impact factor is simply one indicator of a journal’s quality and shouldn’t be used as the sole criterion to assess a journal’s quality or the significance of a particular article. Other aspects including the journal’s scope, the people it caters to, and the significance and originality of the research it publishes should also be taken into account.
I have written an article on Avoiding Predatory Conferences and Journals: A Step by Step Guide for Researchers. This article will help in classifying the journal as good or predatory. You can visit the post for more details.
2. Eigen Factor (EF) and Eigen Score (ES)
Eigenfactor (EF)
In the context of ranking journals, Eigenfactor (EF) is a metric that aims to assess the overall influence of a scientific journal within the network of academic publications. It takes into account both the number of citations a journal receives and the importance of the journals that cite it. Here are some key points about Eigenfactor:
- Focuses on influence: Unlike the Impact Factor (IF) which mainly considers the average number of citations received by a journal’s articles in the past two years, Eigenfactor focuses on the journal’s broader influence in the scientific community.
- Considers citation source: Similar to SCImago Journal Rank (SJR), Eigenfactor goes beyond just the number of citations and considers the prestige of the journals that provide those citations. A citation from a highly influential journal carries more weight than a citation from a less prominent one.
- Network analysis: Eigenfactor leverages concepts from network analysis to understand the relationships between journals. It considers the entire network of citations and assigns scores based on the reciprocal influence within that network.
Here’s a simplified analogy: Imagine a group of scholars having discussions and referencing each other’s work. A scholar with many connections and frequently referenced by others would be considered highly influential, similar to how a journal with numerous citations, especially from prestigious sources, would have a high Eigenfactor score.
It’s important to note:
- Eigenfactor, like other metrics, has its limitations and should be used in conjunction with other factors when evaluating a journal.
- The specific calculation of Eigenfactor is quite complex and involves mathematical algorithms. However, understanding the core concept of considering both citation quantity and quality should give you a good grasp of what it signifies.
Illustrative Example
The exact calculation of Eigenfactor is quite complex and involves advanced linear algebra. However, we can break down the core idea and see how it works with a simplified example:
Core Idea: Imagine a network of journals where each journal is connected to others by citation links. A journal’s influence is determined by both the number of citations it receives and the influence of the journals citing it.
Simplified Example:
Let’s consider three journals: A, B, and C.
- Journal A: Receives 5 citations (2 from B, 2 from C, and 1 from a less influential journal).
- Journal B: Receives 3 citations (all from A).
- Journal C: Receives 4 citations (all from A).
Here’s how we might estimate a simplified Eigenfactor score (EF):
- Initial Scores: Assign an initial score of 1 to each journal (EF(A) = 1, EF(B) = 1, EF(C) = 1).
- Iterative Calculation: In each iteration, a journal’s score is updated based on the influence of journals citing it:
- Journal A: Receives citations from B (EF(B)) and C (EF(C)) so its updated score might be: EF(A) = (2 * EF(B)) + (2 * EF(C))
- Journal B: Receives citations only from A (EF(A)) so its updated score might be: EF(B) = (EF(A))
- Journal C: Receives citations only from A (EF(A)) so its updated score might be: EF(C) = (EF(A))
- Repeat and Normalize: Repeat step 2 until the scores stabilize (don’t change significantly). Finally, normalize the scores (divide by a constant) so they fall within a specific range.
In this simplified example:
- Journal A gets a higher score than B and C because it receives citations from both (assumed to be influential).
- B and C get the same score because they both cite only A (whose influence is yet to be determined).
This is a very basic illustration, but it captures the essence of Eigenfactor. The actual calculation involves a more complex iterative process that considers the entire network of citations and the influence of all journals within that network.
Eigen Factor Score (ES):
- Concept: A specific numerical score derived from the Eigen Factor calculation.
- Represents: The quantitative measure of a journal’s influence based on the Eigen Factor concept.
- Interpretation: Higher ES indicates greater influence within the academic community.
Analogy:
Think of Eigen Factor as a recipe for calculating influence, while Eigen Factor Score is the final dish resulting from that recipe. The recipe (EF) outlines the steps and ingredients (citation data), while the dish (ES) is the finished product (numerical score).
Key points to remember:
- EF is a broader concept, while ES is a specific numerical output.
- EF lays the foundation, and ES provides a quantifiable measure based on that foundation.
- Both terms are used in the context of assessing the influence and prestige of academic journals.
3. Source Normalized Impact per Paper(SNIP)
A metric called SNIP (Source Normalized Impact per Paper) is used to assess the influence of journals in the area of academic research. It is created by Scopus Journal Analyzer, an Elsevier product.
Source-Normalized Impact per Paper (SNIP) evaluates the contextual citation impact of journals by factoring in the citation count within a specific subject field. This innovative approach enables a direct comparison of sources across various subject areas, assigning greater significance to a single citation’s impact in fields with fewer citations and vice versa.
SNIP is presented as a ratio, comprising a numerator and a denominator. The numerator, termed the journal’s Impact per Publication (IPP), calculates the average citations received in a given year (e.g., 2024) by papers published in the journal over the preceding three years (e.g., 2021, 2022, and 2023).
The denominator in SNIP is the Database Citation Potential (DCP). Recognizing substantial variations in citation frequency across scientific subfields, an indicator is computed for each journal to represent citation potential within its subject field. This citation potential is incorporated into SNIP’s denominator, the DCP. SNIP is obtained by dividing IPP by DCP.
SNIP facilitates a straightforward comparison of sources in different subject fields, uncovering variations not only between journal subject categories but also within the same category. For instance, basic journals often display higher citation potentials than applied or clinical journals, and journals addressing emerging topics tend to surpass those focused on classical subjects or general themes.
Illustrative Example
Imagine we have two academic journals, Journal A and Journal B, both publishing papers in the field of environmental science. Now, Journal A publishes fewer papers, but each paper receives a higher average number of citations. On the other hand, Journal B publishes more papers, but the citations per paper are lower on average.
If we were to evaluate these journals solely based on the number of citations each paper receives (without considering the subject field), we might incorrectly conclude that Journal B is more influential because it has a higher overall citation count. However, SNIP takes into account the citation habits within the subject field.
SNIP’s calculation involves dividing the Impact per Publication (IPP) by the Database Citation Potential (DCP). The IPP represents the average citations a journal’s papers receive, and the DCP considers the citation potential within the subject field.
In our example, let’s say Journal A has a lower IPP (due to fewer papers) but also a lower DCP (indicating a field where citations are less common in a particular sub-discipline, such as ecology). On the other hand, Journal B has a higher IPP but also a higher DCP (indicating a field where citations are more common, perhaps encompassing a broader range of topics such as environmental chemistry, engineering, and ecology.).
When we calculate SNIP (IPP divided by DCP), we find that Journal A’s SNIP might be higher, suggesting that its papers have a more significant impact within the specific subject field of environmental science say ecology, even though Journal B may have a higher raw citation count.
In essence, SNIP provides a normalized measure that accounts for the citation habits in a particular subject field, allowing for a fairer comparison of the impact of journals across different disciplines.
Authors can utilize SNIP to identify top-performing journals within their subject area, aiding them in making informed decisions about where to publish. The visualization allows users to hover over circles and click on the year to access the journal’s metrics. The size of the circles is relative to the highest values within the 5-year range, with a closed circle representing the peak value and open circles indicating the journal’s value relative to this maximum.
3. SJR (SCImago Journal Rank) Metric
The SCImago Journal Rank (SJR) metric is a way to assess the prestige of scholarly journals. It takes into account both the number of citations a journal receives and the importance of the journals that cite it.
Here are some key points about SJR:
- Inspired by PageRank: The calculation of SJR is similar to the algorithm used by Google to rank web pages, called PageRank. Just like in PageRank, where a website’s importance is influenced by the importance of the websites that link to it, SJR considers a journal’s prestige to be influenced by the prestige of the journals that cite it.
- Focuses on “prestige per article”: SJR aims to provide an average prestige per article published in a journal. This makes it a size-independent metric, meaning it is not simply influenced by the number of articles a journal publishes.
- Freely available: SJR is a free metric that you can access on the SCImago Journal & Country Rank portal (https://www.scimagojr.com/).
- Limitations: It’s important to remember that SJR is just one metric among many, and it should not be used as the sole indicator of a journal’s quality. Other factors, such as the journal’s editorial board, peer-review process, and scope, should also be considered when evaluating a journal.
Illustrative Example
let’s imagine two journals:
- Journal A: This journal publishes a moderate number of articles (around 50 per year) in a specific scientific field. It receives a decent amount of citations, but mostly from other journals within its field that aren’t considered top-tier.
- Journal B: This journal is a well-established publication in a broader scientific field. It publishes a higher volume of articles (around 100 per year) and tends to get cited more frequently. However, the citations it receives often come from highly prestigious journals across various scientific disciplines.
Here’s how SJR might handle these two journals:
- Journal A: Although it gets cited a decent amount, the citations come from journals with lower SJR scores. This means the prestige it transfers through citations is limited.
- Journal B: Even though it might not have the most citations overall compared to Journal A, the citations it does receive come from high-impact journals. This translates to a higher transfer of prestige, potentially giving it a significantly better SJR score than Journal A.
In this scenario, SJR would likely rank Journal B as more prestigious than Journal A, even though Journal A publishes fewer articles. This reflects the fact that Journal B’s articles are being noticed and referenced by leading journals in the field, which signifies a greater impact.
SJR is widely used in academic research to evaluate the quality and impact of journals. It is available for free on the SCImago Journal & Country Rank website, where journals are ranked in several categories such as subject area, country, and publisher.
Types of Journal Ranking Systems
As the scholarly publishing landscape continues to evolve, reliable and effective journal ranking systems play a vital role in assessing the quality and impact of journals. Several well-known ranking systems, such as Journal Citation Reports (JCR), Scopus Journal Ranking System, Web of Science Journal Ranking System, and Scimago Journal Ranking System, are widely used by researchers, publishers, and institutions.
Each of these systems has its own unique methodology and criteria for evaluating journals, providing valuable insights into their performance and influence in the academic community. In this section, we will explore the various types of journal ranking systems, highlighting their features, strengths, and limitations.
It is essential for researchers and stakeholders in the academic publishing ecosystem to understand the nuances of these ranking systems as they navigate the complex world of scholarly communication and make informed decisions about journal selection and publication strategies.
I. Journal Citation Reports (JCR) Ranking System
Data on scholarly journals in the social sciences and sciences is provided by Clarivate Analytics (formerly Thomson Reuters’) Journal Citation Reports (JCR). It offers a variety of measures and covers thousands of journals from across the globe.
One of these metrics is the Journal Impact Factor (JIF), which is a gauge of the typical number of citations earned in a given year by articles published in a certain journal over the two years prior. Other measures offered by JCR include the Eigenfactor score, the Cited Half-Life, and the Immediacy Index.
JCR is a popular tool in the academic world for assessing the value and influence of journals. Many funding agencies and institutions utilise JCR data to assess the research output of their staff. Researchers and librarians use JCR to find and compare publications in their discipline.
It is important to keep in mind that JCR only covers a portion of all journals and that not all journals will be included in the JCR database. As a result, JCR should not be considered the only method of evaluating journals, as Scopus and Web of Science have their own metrics and classification schemes that may differ slightly.
How the Cutoff Values are Calculated for Q1, Q2, Q3 and Q4?
The JCR chooses the cutoff values each year. They are determined by multiplying the total number of journals in a category by 4, then ordering the journals in that category according to impact factor. The journal with the highest impact factor is the highest-ranked journal in the first quartile (Q1), the second-highest impact factor is the highest-ranked journal in the second quartile (Q2), and so on.
It’s important to remember that the JCR is not the only classification scheme for journals because it only encompasses a portion of all journals and not all journals will be included in the JCR database. The cutoff values may slightly differ in some other databases with their own classification schemes, such as Scopus and Web of Science.
A journal’s JIF has dropped and it has moved to a lower category if it has been degraded. For instance, a journal that was formerly regarded as a Q1 journal but has since been degraded would now be regarded as a Q2 journal.
It’s critical to remember that JIF is not the only indicator of a journal’s quality. When evaluating a journal’s quality, other aspects can be considered as well, including the editorial board, the journal’s scope, and the rigorousness of the peer-review process.
How to check JCR based Q1, Q2, Q3, Q4 ?
The Web of Science database is used to provide data for the Journal Citation Reports (JCR). JCR is a creation of Clarivate Analytics, which also manages the Web of Science database and was formerly Thomson Reuters’ Intellectual Property and Science division.
A measure of the impact and influence of scholarly journals is provided by the JCR using data from the Web of Science database. This data includes details on the number of citations that articles published in the journal have received, the total number of articles published in the journal, and the standing of the journals that have cited the journal in question. JCR is a popular technique for evaluating the calibre of journals and is regarded as a trustworthy source of information when doing so.
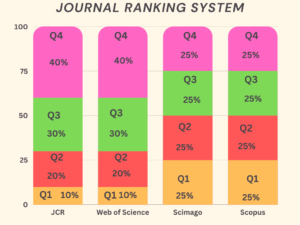
JCR (Journal Citation Reports) is a database that provides a measure of a journal’s impact and influence in its field. JCR uses a variety of metrics, including the Journal Impact Factor (JIF), to classify journals into four tiers:
- Q1 (top 10% of journals in the field)
- Q2 (next 20% of journals in the field)
- Q3 (next 30% of journals in the field)
- Q4 (bottom 40% of journals in the field)
To check the JCR classification of a journal, you can follow these steps:
- Go to the JCR website (https://jcr.clarivate.com/)
- Click on the “By Journal” tab
- In the search bar, type in the name of the journal you want to check
- Click on the journal title from the search results
- Scroll down to the “Category Information” section to view the journal’s JCR classification
It’s important to note that JCR classification is based on the Journal Impact Factor (JIF) which is calculated based on the number of citations a journal receives in a given year. It’s just one of the metrics to evaluate a journal. Other factors such as the methodology, sample size, and results of the study are also important to consider when evaluating the research.
II. Scopus Journal Ranking System
The Scopus database, a premier abstract and citation database of peer-reviewed literature, offers the Scopus Journal Analyzer as one of its tools. Researchers, libraries, and publishers can use the tool to compare and analyze the performance of various journals.
Users of the Scopus Journal Analyzer can compare the performance of journals using a range of criteria, such as the number of papers produced, the number of citations per article, and the number of citations received. Additionally, users can contrast publications depending on their publisher, country of origin, and subject matter.
Use the Scopus Journal Analyzer tool to look up journals by name or ISSN and view ranking data, such as their percentile and quartile ranks (Q1, Q2, Q3, Q4), as well as their SJR and SNIP scores.
The SNIP (Source Normalized Impact per Paper) and SJR (SCImago Journal Rank) criteria are used to categorize journals in Scopus. The number of citations a journal receives, the number of articles it publishes, and the reputation of the journals that cite the journal in question are all factors considered by SNIP when calculating the contextual citation impact of a given journal.
SJR, on the other hand, measures a journal’s prestige by taking into account the number of citations it has received, the number of papers it has published, and the stature of journals that have cited it.
Based on the SNIP and SJR values, journals are then divided into quartiles. The most prestigious and influential journals are those published in Q1, whereas the least prestigious and least influential journals are those published in Q4.
It’s vital to remember that depending on the field or topic area, the quartiles used to group journals can change. Scopus classifies journals according to subject areas, therefore a journal in one field can be categorized as Q1, while the same journal in another field might be categorized as Q2.
It’s also crucial to note that Scopus categorizes journals into Q1, Q2, Q3, and Q4 categories based on how well they performed over a three-year period and that JCR and SJR are based on the current year’s performance.
To check a journal’s ranking in the Scopus database, one can go to the Scopus website (https://www.scopus.com/) and use the search function to find the journal in question. Once the journal’s page appears, the Quartile ranking will be listed under the “CiteScore” heading.
The CiteScore is a measure of the average number of citations received in a particular year by all papers published in that journal during the three preceding years. The quartile ranking is based on this metric. The journal is divided into 4 quartiles, Q1, Q2, Q3, and Q4, based on their CiteScore.
Q1 represents the top 25% of journals in a particular field, Q2 represents the next 25% of journals in a particular field, Q3 represents the next 25% of journals in a particular field and Q4 represents the bottom 25% of journals in a particular field.
To check a journal’s quartile ranking using the Scopus Journal Analyzer, you can follow these steps:
- Go to the Scopus website (https://www.scopus.com/)
- Click on the “Journal Analyzer” link on the top menu
- Enter the name of the journal you want to check in the search bar
- Select the journal from the search results
- Scroll down to the “Journal Metrics” section on the journal’s page
- You will find the quartile ranking under the “CiteScore Quartile” or “SCImago Journal Rank (SJR) Quartile”
Keep in mind that the Scopus Journal Analyzer can be accessed only by subscribing institutions or individuals, if you are not one of them, you can try searching for the journal in the Scopus database and see if you can see the quartile ranking.
How Scopus Ranks Journals to Q1 Q2 Q3 Q4 ?
Scopus, a product of Elsevier, uses a different methodology to classify journals into quartiles (Q1, Q2, Q3, and Q4) than the Journal Citation Reports (JCR) and the SCImago Journal Rank (SJR).
The classification of journals in Scopus is based on the SNIP (Source Normalized Impact per Paper) and the SJR (SCImago Journal Rank) metrics. SNIP measures the contextual citation impact of a journal, taking into account the number of citations received by a journal, the number of articles published in the journal, and the prestige of the journals citing the journal in question.
SJR, on the other hand, is a measure of the prestige of a journal and takes into account the number of citations received by a journal, the number of articles published in the journal, and the prestige of the journals citing the journal in question.
Journals are then classified into quartiles based on their SNIP and SJR values. Q1 journals are considered to be the most prestigious and have the highest impact, while Q4 journals are considered to be the least prestigious and have the lowest impact.
It’s important to note that the classification of journals into quartiles can vary depending on the field or subject area. Scopus provides a subject area-specific classification of journals, which means that a journal in one field may be classified as Q1, while the same journal in another field may be classified as Q2.
It’s also important to mention that Scopus classifies journals in Q1, Q2, Q3 and Q4 based on their performance over a period of three years, JCR and SJR are based on the current year’s performance.
III. Web of Science Journal Ranking System
Web of Science, also known as the Web of Knowledge, is a database of academic literature provided by Clarivate Analytics. It is a widely used tool for academic research and is known for its high-quality data and advanced search capabilities.
Web of Science uses the Journal Citation Reports (JCR) to rank journals. The JCR is an annual publication that provides data and rankings for academic journals in the sciences, social sciences, and humanities. The JCR uses a two-part methodology to rank journals, which includes the Impact Factor (IF) and the Eigenfactor Score (ES).
Web of Science ranks journals in four categories: Q1, Q2, Q3, and Q4. These categories are based on the Impact Factor(IF) and Eigenfactor Score (ES) of each journal. Q1 journals are considered the most prestigious and have the highest IF and ES scores. Q4 journals are considered the least prestigious and have the lowest IF and ES scores.
Web of Science also provides other metrics such as the 5-Year Impact Factor, Immediacy Index, Cited Half-Life, Citing Half-Life and Article Influence Score which can be used to analyze the performance of the journal.
Web of Science classification of journals
Web of Science is a research database that provides metrics on a journal’s impact and influence in its field. Web of Science classifies journals into four categories based on the number of citations a journal receives, the number of articles published, and the prestige of the journals citing the journal in question. The classification system is:
- Q1: top 10% of journals in the field
- Q2: next 20% of journals in the field
- Q3: next 30% of journals in the field
- Q4: bottom 40% of journals in the field
To check the Web of Science classification of a journal, you can follow these steps:
- Go to the Web of Science website (https://www.webofknowledge.com/)
- Click on the “Journals” tab
- In the search bar, type in the name of the journal you want to check
- Click on the journal title from the search results
- Scroll down to the “Journal Profile” section to view the journal’s Web of Science classification
It’s important to note that the Web of Science classification is based on the number of citations a journal receives in a given year. Other factors such as the methodology, sample size, and results of the study are also important to consider when evaluating the research.
IV. Scimago Journal Ranking System
SCImago Journal Ranking System uses SCImago Journal Rank metric to evaluate the impact of journals in the field of scholarly research. It is developed by SCImago Research Group, a research group based in Spain.
SJR is similar to the Impact Factor (IF) and SNIP (Source Normalized Impact per Paper) metrics, but it is based on a different algorithm, which is designed to give a more accurate and robust representation of the impact of journals. SJR also takes into account the prestige of the journals citing the journal in question, which is not considered in the IF or SNIP metrics.
SJR is widely used in academic research to evaluate the quality and impact of journals. It is available for free on the SCImago Journal & Country Rank website, where journals are ranked in several categories such as subject area, country, and publisher.
How to check SCImago based Q1, Q2, Q3, Q4 ?
SJR uses a four-tier classification system similar to JCR and Web of Science, where each journal is assigned an SJR score, and then journals are grouped into four quartiles based on the scores:
- Q1: top 25%
- Q2: next 25%
- Q3: next 25%
- Q4: bottom 25%
SJR also provides information on the H-index of a journal, which is a measure of the productivity and citation impact of the publications of a scientist or scholar.
The SJR classification system is freely available and it’s based on the Scopus database and it’s a good way to evaluate the scientific quality of the journal.
To check a journal ranking in the SCImago Journal & Country Rank (SJR) database, one can go to the SJR website (https://www.scimagojr.com/) and use the search function to find the journal in question. Once the journal’s page appears, the Quartile ranking will be listed under the “SJR” heading.
The SJR metric is a measure of a journal’s relative impact, taking into account both the number of citations received by a journal and the importance or prestige of the journals where such citations come from. The quartile ranking is based on this metric.
The journal is divided into 4 quartiles, Q1, Q2, Q3, and Q4, based on their SJR. Q1 represents the top 25% of journals in a particular field, Q2 represents the next 25% of journals in a particular field, Q3 represents the next 25% of journals in a particular field and Q4 represents the bottom 25% of journals in a particular field.
Comparison of Various Journal Ranking Systems
Classification strategies used by JCR, Web of Science, SCImago Journal Rank (SJR), and Scopus, as well as how Q1, Q2, Q3, and Q4 are calculated:
| Classification System | Classification Strategy | How Q1, Q2, Q3, Q4 are Calculated |
|---|---|---|
| JCR (Journal Citation Reports) | Impact Factor (IF) | JCR uses the IF to classify journals into four quartiles, Q1, Q2, Q3, Q4. Q1 includes the top 25% of journals with the highest IF, Q2 includes the next 25%, Q3 includes the next 25%, and Q4 includes the bottom 25%. |
| Web of Science | Number of citations, number of articles published, and the prestige of the journals citing the journal in question | Web of Science classifies journals into four quartiles based on a combination of factors such as the number of citations, the number of articles published, and the prestige of the journals citing the journal in question. The journals in Q1 have the highest scores, followed by Q2, Q3 and Q4. Q1: top 10% of journals in the field Q2: next 20% of journals in the field Q3: next 30% of journals in the field Q4: bottom 40% of journals in the field |
| SCImago Journal Rank (SJR) | Number of citations, number of articles published, and the prestige of the journals citing the journal in question | SJR uses the number of citations, the number of articles published, and the prestige of the journals citing the journal in question to classify journals into four quartiles, Q1, Q2, Q3, Q4. Q1 includes the top 25% of journals with the highest SJR, Q2 includes the next 25%, Q3 includes the next 25%, and Q4 includes the bottom 25%. |
| Scopus | Number of citations, number of articles, and the prestige of the journals citing the journal in question, CiteScore | Scopus classifies journals into four quartiles based on CiteScore. CiteScore is the ratio of the number of citations in a year to the number of documents published in the three previous years. Q1 includes the top 25% of journals with the highest CiteScore, Q2 includes the next 25%, Q3 includes the next 25%, and Q4 includes the bottom 25%. |
It’s worth noting that each classification system has its own set of criteria and methods for calculating the quartiles, and the classification may vary depending on the field of study and the type of journal. Additionally, it’s also important to consider other factors such as the scope of the journal, the quality of the editorial board, the rigour of the peer-review process, the relevance of the research published, and the number of readership and citations of the journal when assessing the quality of a journal.
As an author usually you tend to submit papers which are in either in Q1,Q2,Q3 or Q4. But wait before submitting it to journals please refer my articles on :
Avoiding Predatory Conferences and Journals: A Step by Step Guide for Researchers and
08 Reliable Steps to find Good Journals for your Research Paper Publication
There may be a possibility that a few journals may be predatory or just appeared in the ranking list. In such situation it is better to pause , think and submit your articles to good journals. My articles will guide you through this process.
I published my paper in a Journal when it was in Q1 and now it is in Q2: What should I indicate against my Research Paper( Q1 or Q2)?
When describing your paper, you should indicate the category that the journal was in at the time of your publication. If your paper was published in a journal that was considered to be a Q1 journal at the time of publication, you should refer to it as a Q1 paper. If the journal was later downgraded to a Q2 journal, it does not change the fact that your paper was published in a Q1 journal at the time.
It is important, to be honest, and transparent about the journal in which your paper was published. If the journal has been downgraded since the publication of your paper, you may want to include a note or a disclaimer that indicates that the journal was considered to be a Q1 journal at the time of publication, but is now considered to be a Q2 journal.
It’s also worth noting that, if you have the opportunity to update your CV or resume, it is a good idea to include the journal ranking at the time of your publication as well as the current ranking. This gives a clear picture of where the journal was at the time of publication, and where it stands currently.
How to Identify To Which Quartile Journal I Should Submit My Research Paper?
Whether you’re a novice researcher seeking guidance or a seasoned academic refining your approach, join us as we unravel the intricate threads of the “Journal Quartile Finder.” Prepare to equip yourself with the tool to navigate this complex landscape, ultimately ensuring your research paper finds its rightful home among the Q1, Q2, Q3, or Q4 journals, igniting impact and shaping scholarly discourse. I have written a separate article on:
How to Choose Right Journal Quartile (Q1/Q2/Q3/Q4) for My Research Paper?.
In this article I have given a tool ” Journal Quartile Finder” that helps you in identifying the best Quartile for your research paper. Please visit the article for further details.
Before We Close
Unlock Exclusive Access to the PhD Navigator Tool – for a Streamlined Research Experience for FREE!
Dear fellow researchers,
If you are a PhD research scholar or planning to pursue PhD, I understand the value of time in your PhD journey. That’s why I have organized my blog posts related to PhD meticulously, categorizing more than 100 articles into various stages of PhD (from planning of PhD to careers after PhD).
You can get this tool ABSOLUTELY FREE, by sending an email to [email protected] with the subject line “Subscribe: PhD Navigator Tool-1.0” By subscribing not only will you gain free access to this invaluable tool, but you’ll also receive regular updates on this tool and our blog’s latest insights, tips, and resources tailored for researchers.
Happy researching!
Best regards,
Dr Vijay Rajpurohit
Conclusion
There are different ways to check a journal’s ranking, including using databases such as Scopus, JCR (Journal Citation Reports) and Web of Science. Each of these databases uses different metrics to rank journals, such as SNIP and SJR for Scopus, Impact Factor for JCR and CiteScore for Web of Science.
It’s also important to note that the journal ranking system is not linear, but it is based on the field of the journal. Therefore, it is recommended to use different ranking databases and metrics to have a comprehensive understanding of the journal’s reputation and impact.
